This article explains how to use the Measure Tools in Aura to record point coordinates, calculate distances, and measure angles in a point cloud. The result is a set of measurements that can be reviewed, renamed, managed, and exported.
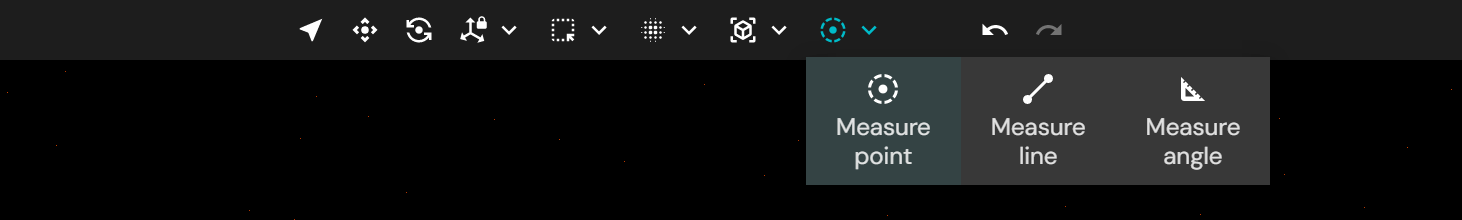
The Measure Tools are valuable for inspections, validation, and for communicating key dimensions directly within the 3D environment. They are accessed from the Main Toolbar, located at the top of the Aura interface.
When a measurement tool is active, Aura displays the full resolution of points around the cursor, enabling accurate point selection. To maintain a performant user experience, points further from the cursor are not displayed. The size of the loaded area adjusts automatically based on the camera position and the current point budget setting.
What you will need
A processed point cloud open in Aura.
(For point export) A georeferenced scan. Aura generates an empty CSV file for scans that are not georeferenced.
Procedure
Step 1: Measure a point
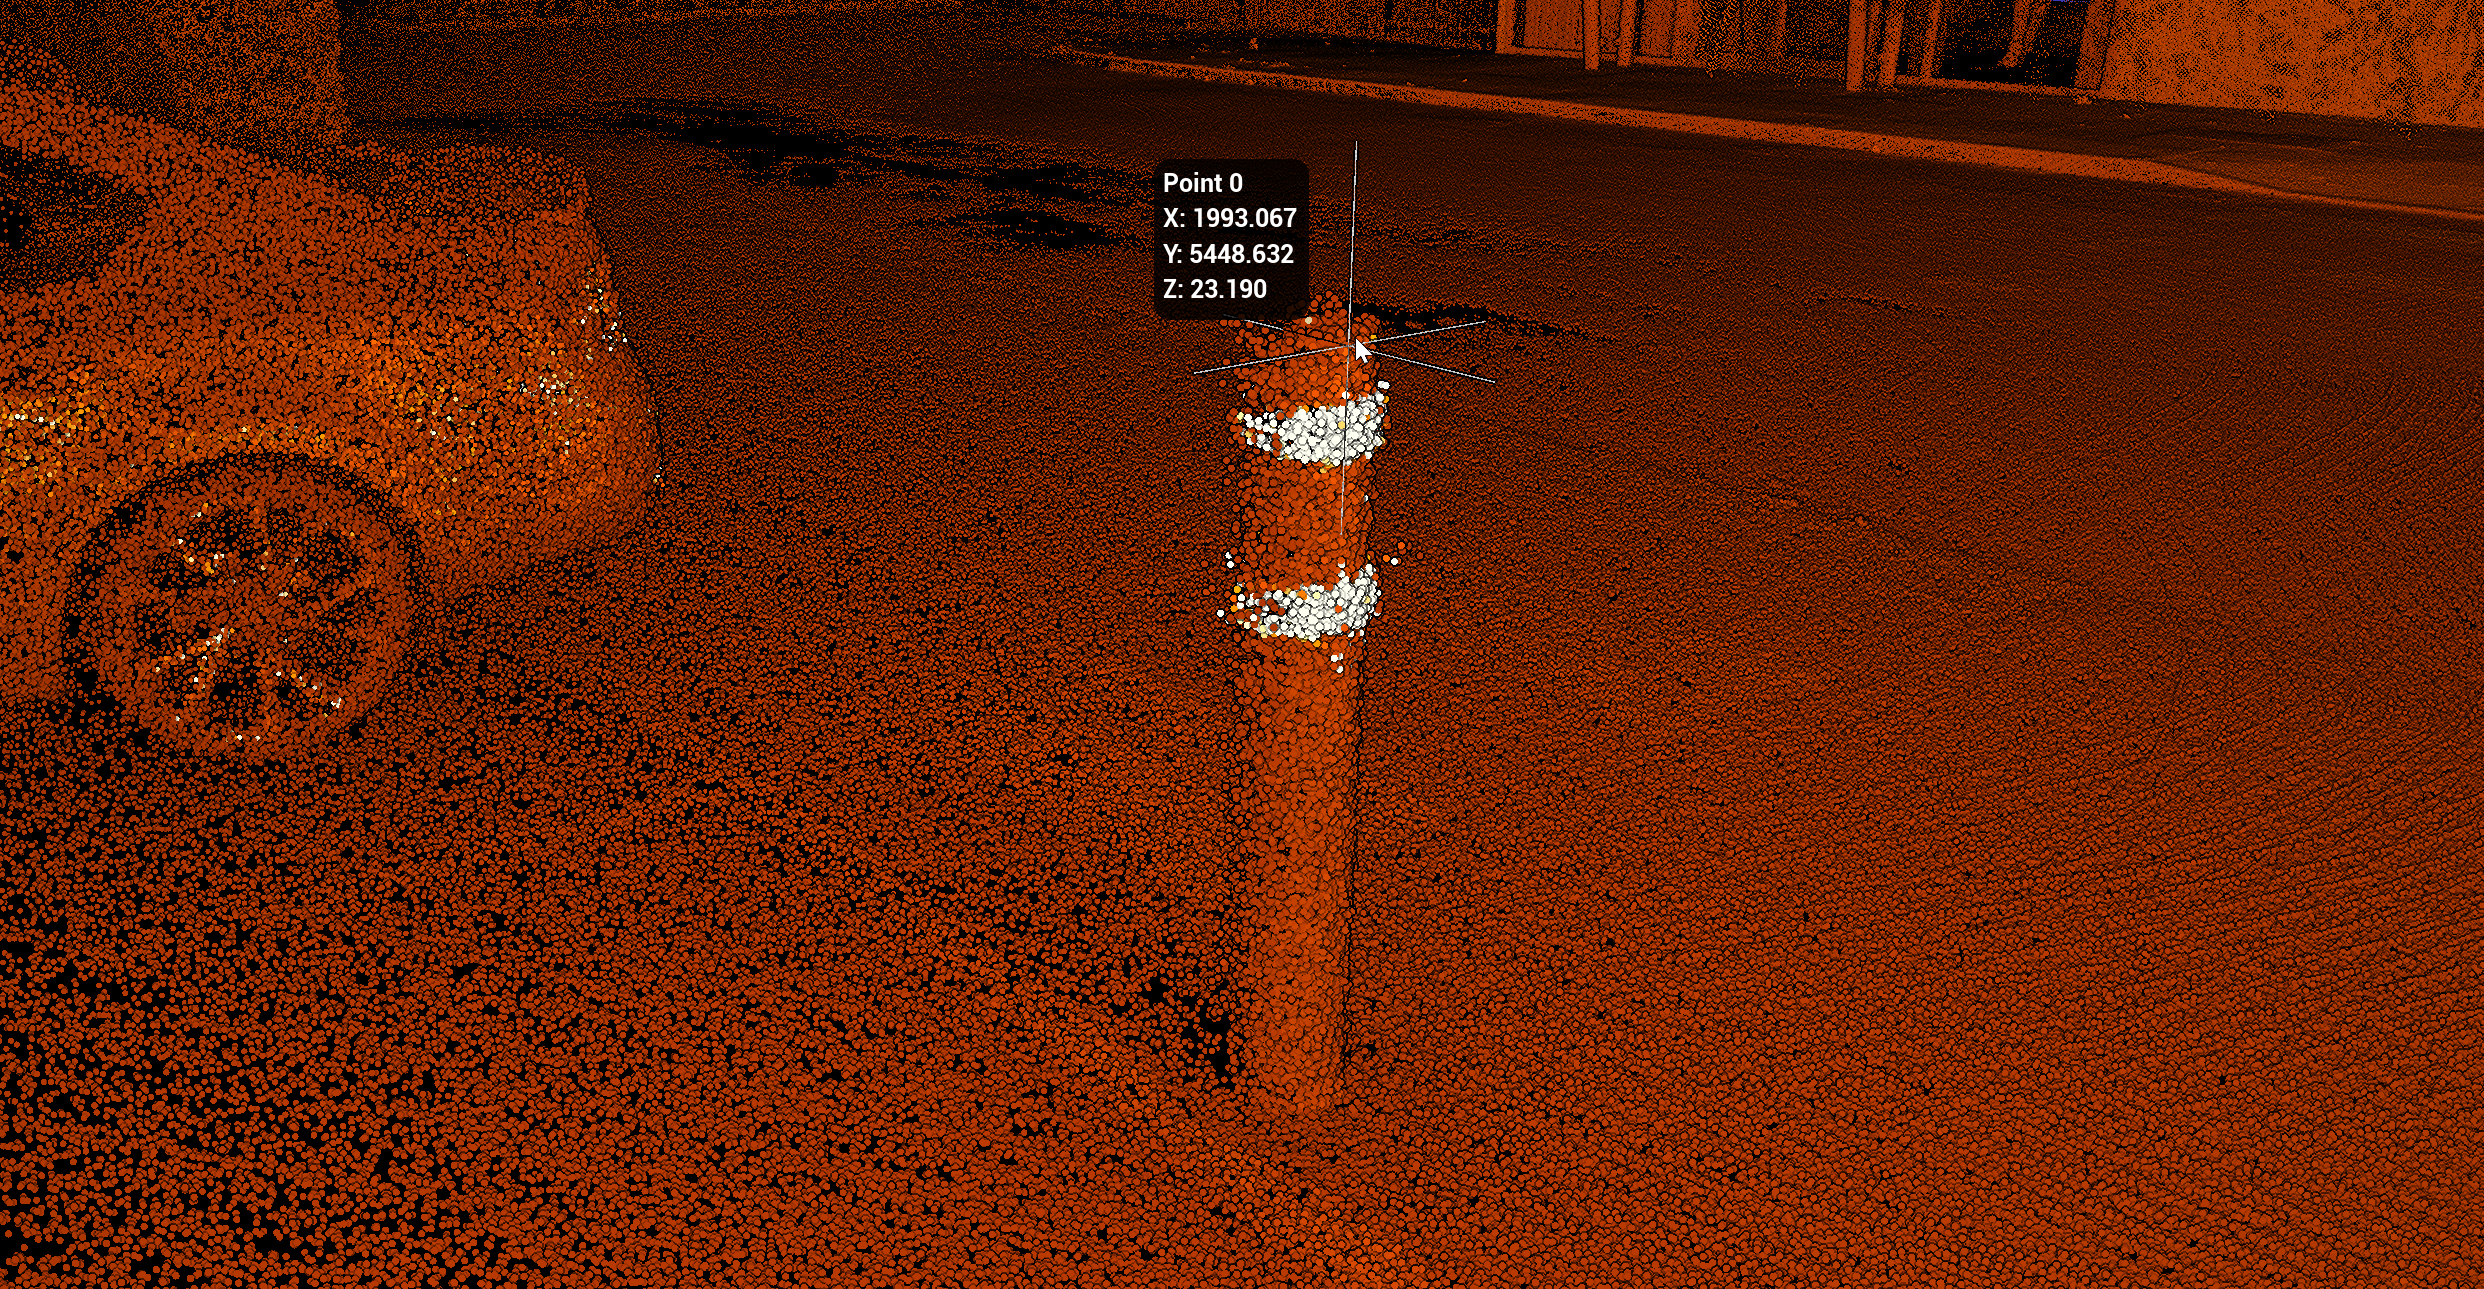
The Measure Point function records the location of a single point in the point cloud.
From the Main Toolbar, select Measure Point.
Click the desired location in the point cloud.
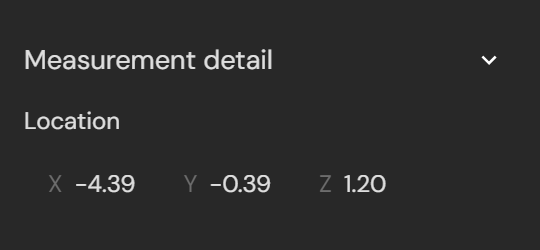
Aura displays an information label showing the point name and its X, Y, and Z coordinates in the project's coordinate reference system.
Step 2: Measure a line
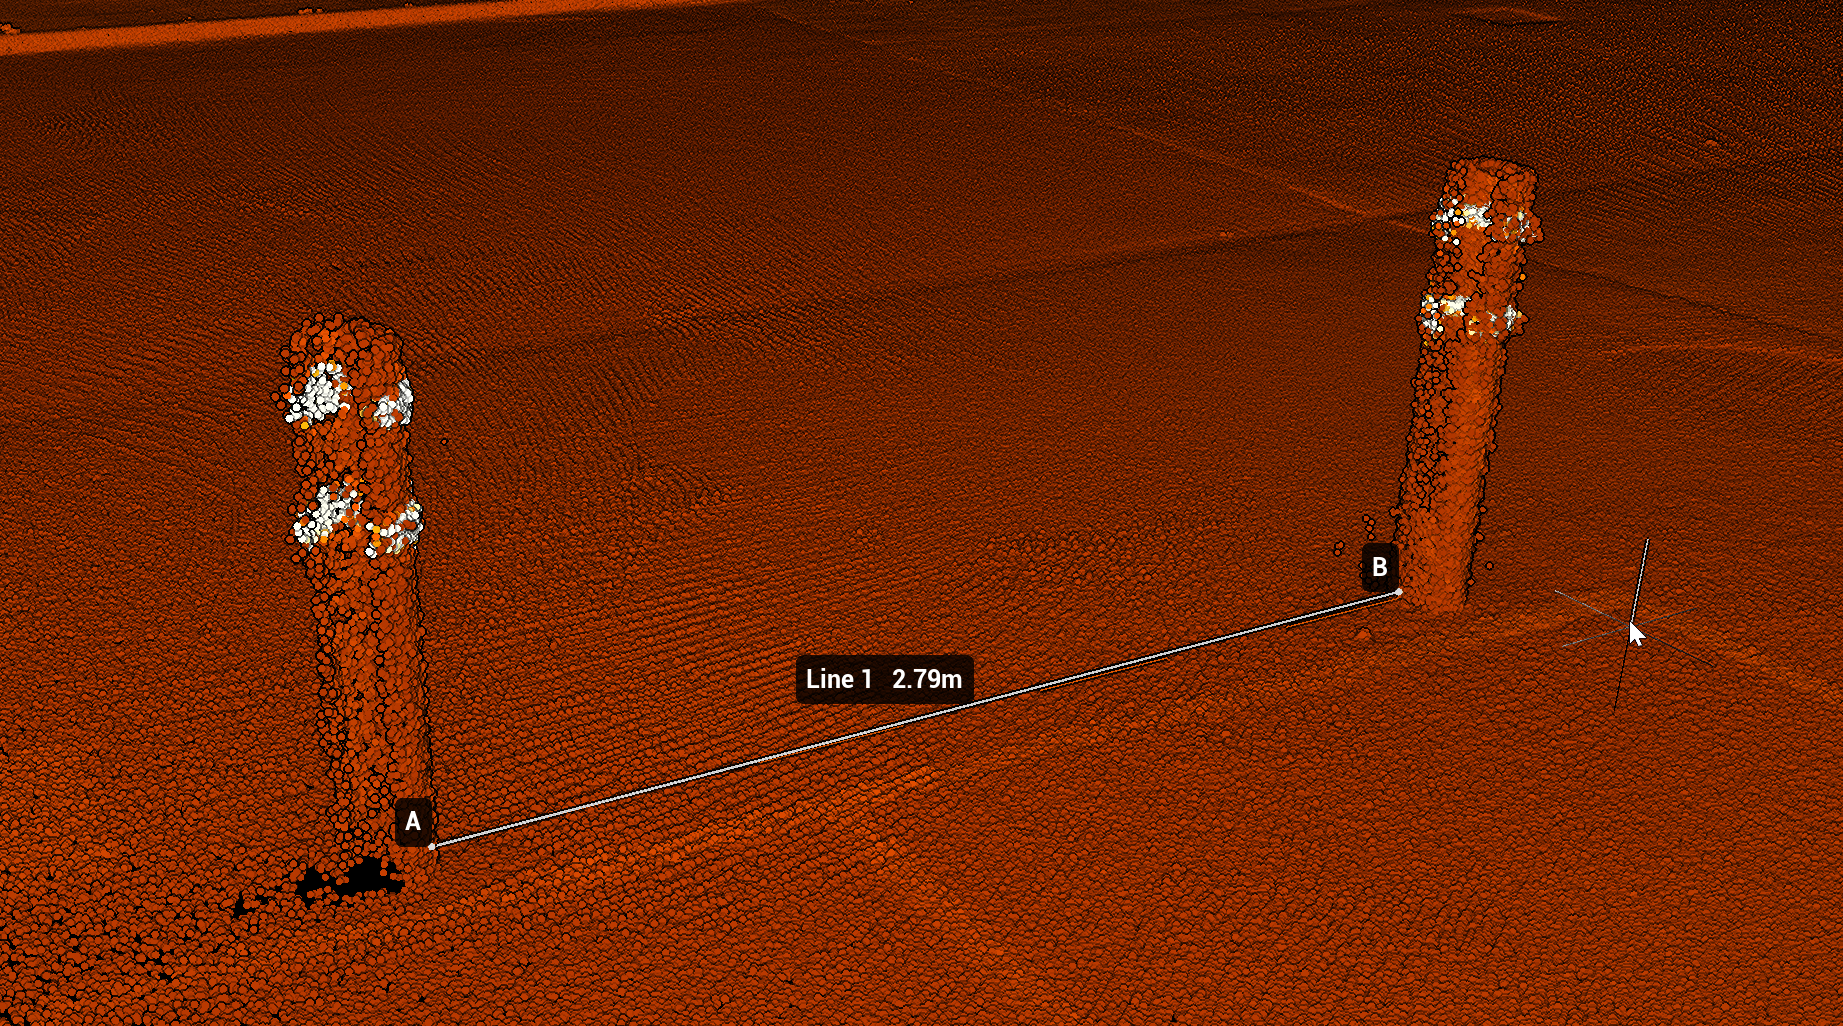
The Measure Line function calculates the distance between two points.
From the Main Toolbar, select Measure Line.
Select a starting point (A) and then an ending point (B).
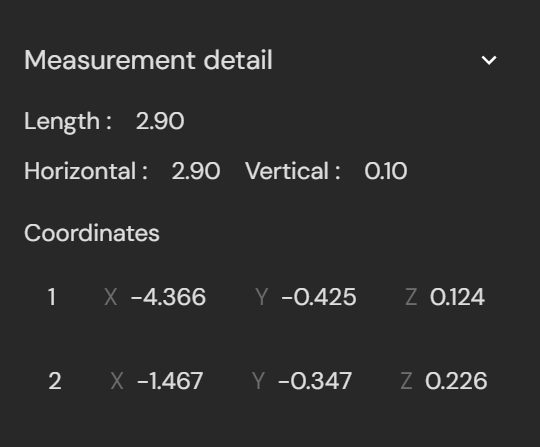
Aura displays labelled markers at each point and generates an information label showing the measured distance and the assigned measurement name.
Step 3: Measure an angle
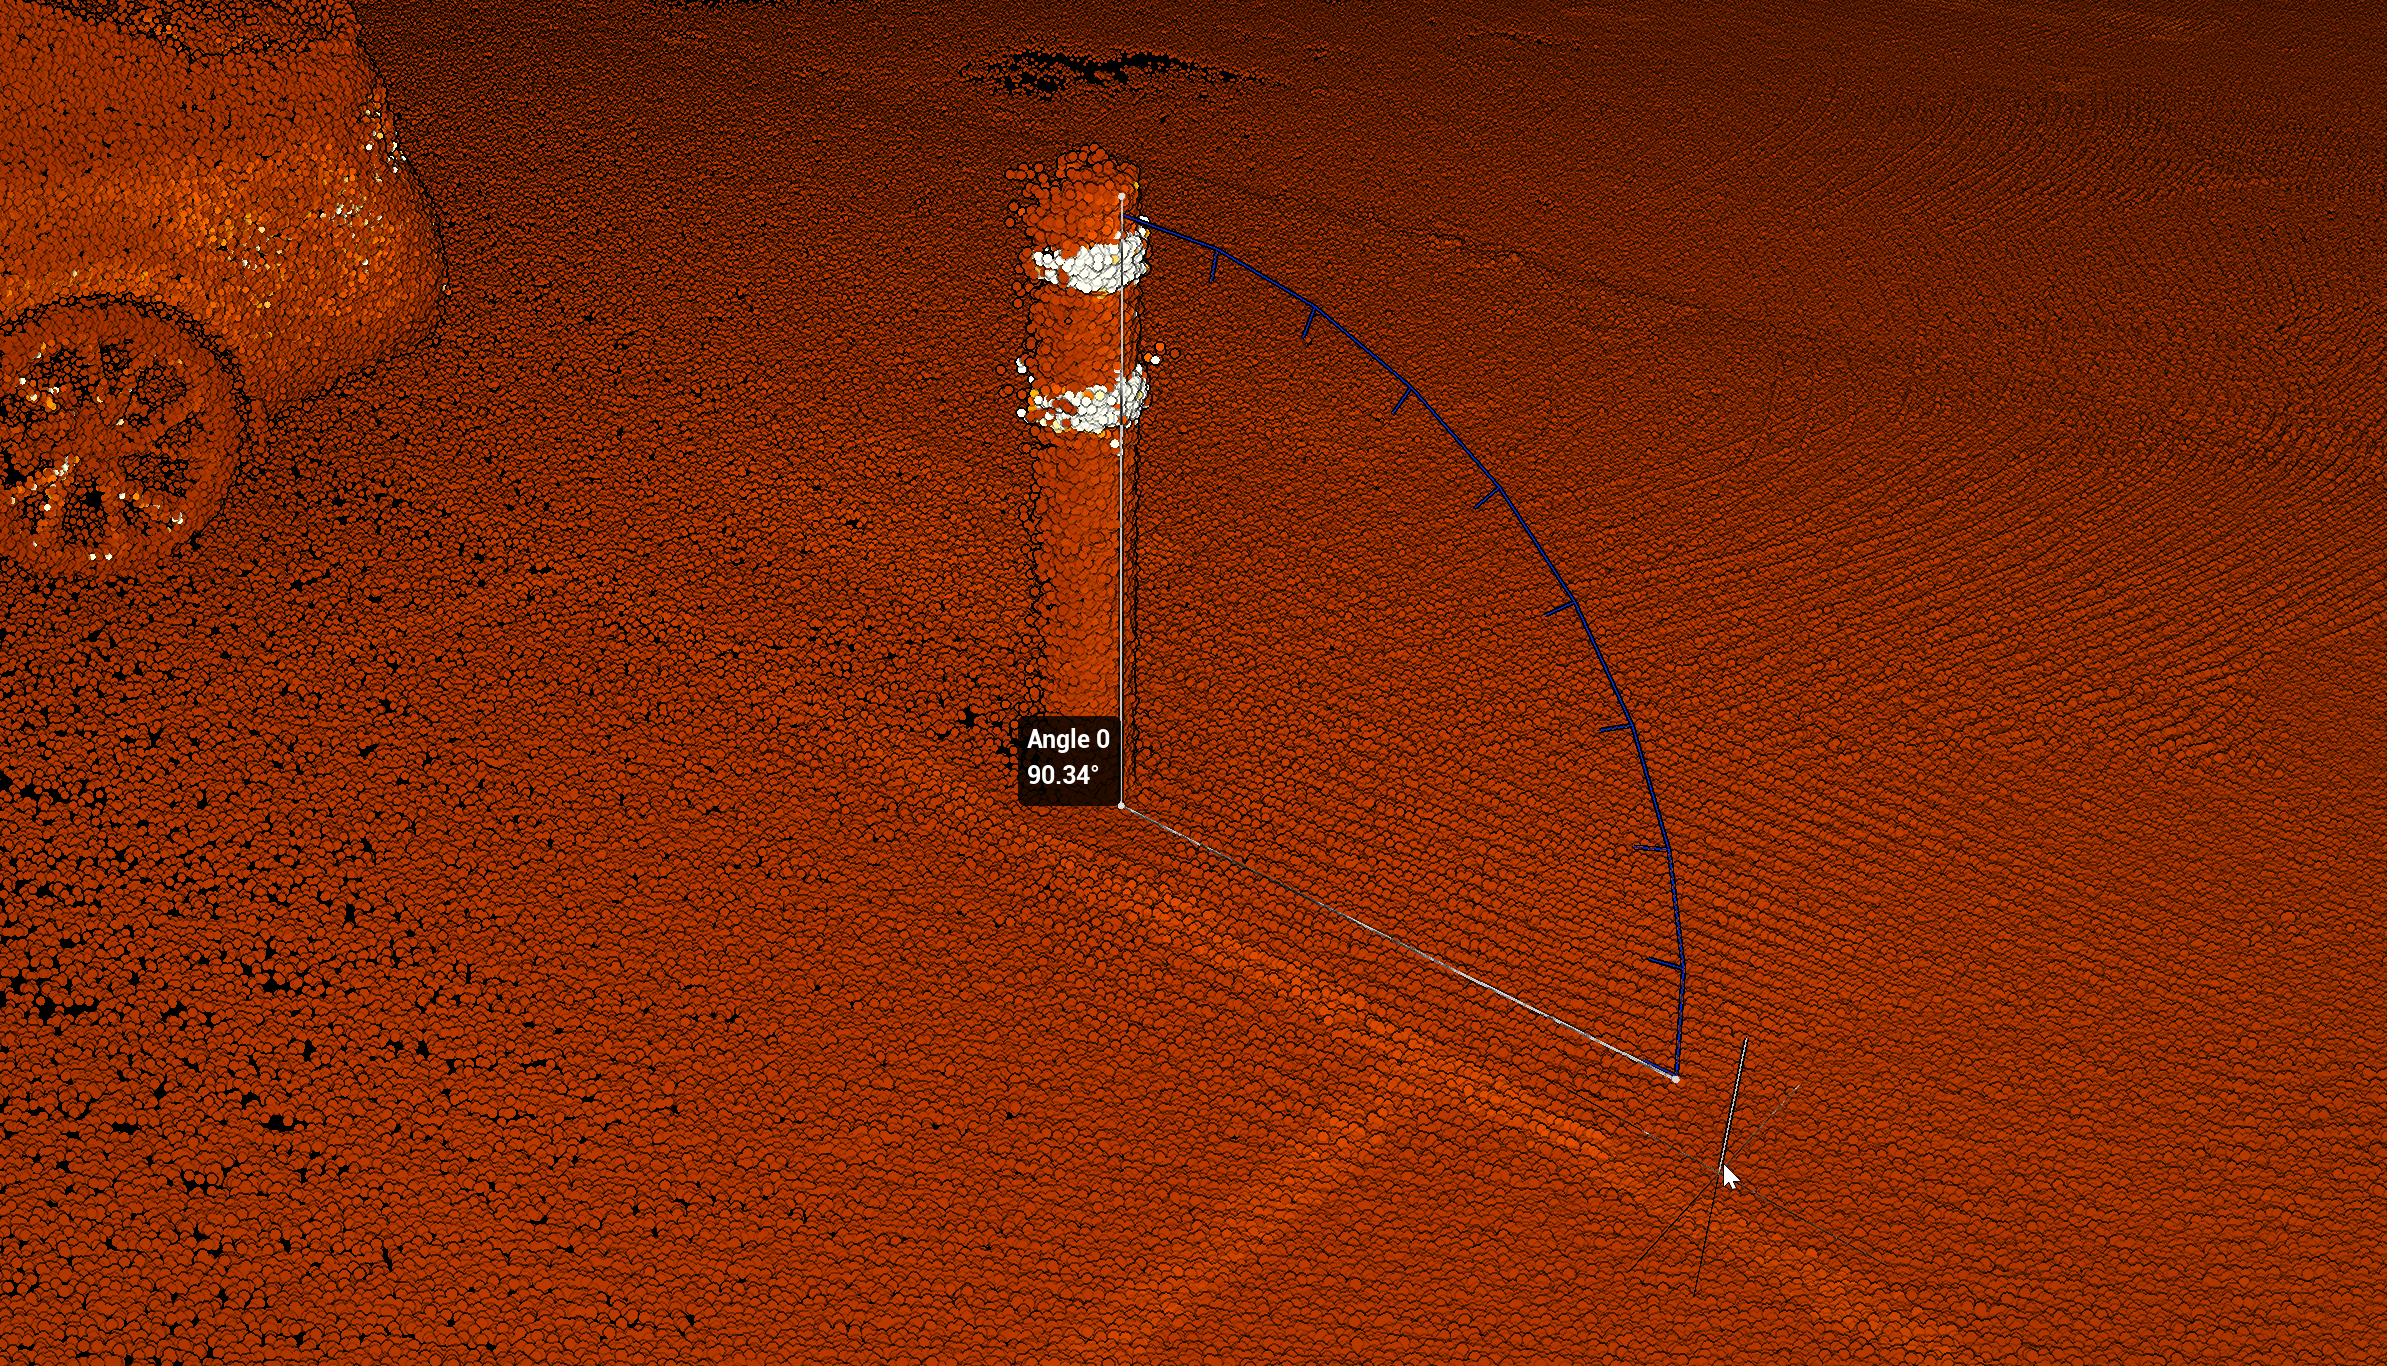
The Measure Angle function calculates the angle formed between three points in 3D space. It is useful for analysing changes in direction, slopes, or intersections within the scan.
From the Main Toolbar, select Measure Angle.
Select the first point to define the start of the first line segment.
Select a second point to define the vertex (the central point of the angle).
Select a third point to define the end of the second line segment.
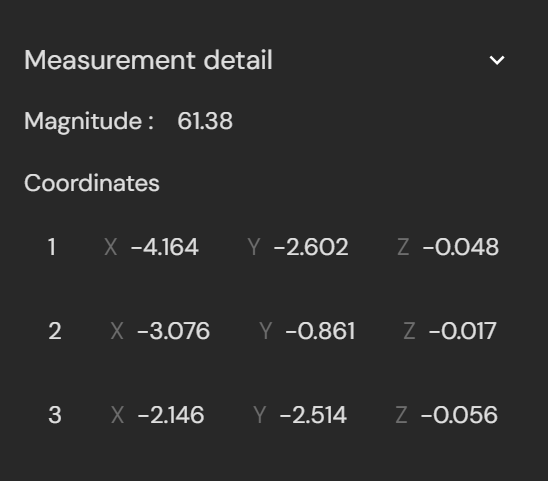
Aura displays labelled markers for each point and generates an information label showing the calculated angle at the vertex and the assigned measurement name.
Step 4: Manage measurements
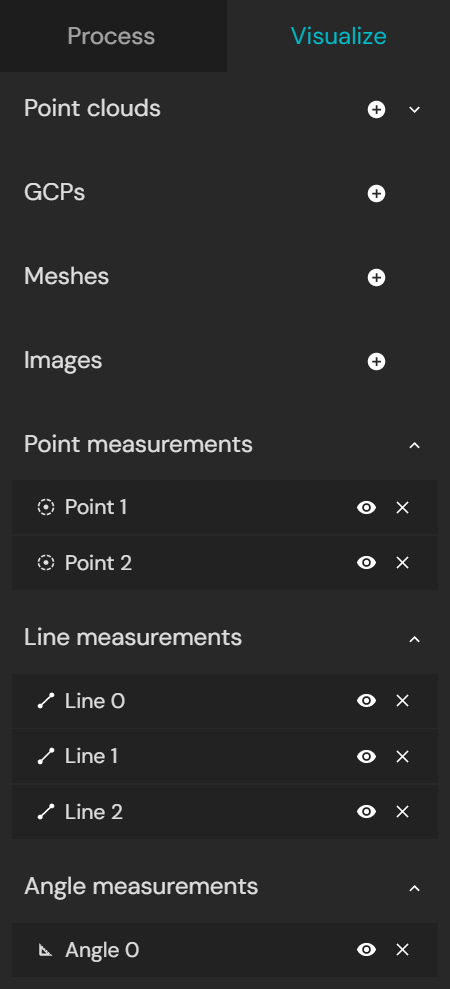
All measurements appear in the Visualize tab and are grouped by type: Point, Line, or Angle. They are named sequentially within each type based on the order of creation. From the Visualize tab, control measurement visibility using the view icon, or delete a measurement permanently using the remove icon.
|
|
Step 5: Rename a measurement
Measurements can be renamed for easier organisation.
Select a measurement in the Visualize tab.
In the Properties panel on the right-hand side, edit the name.
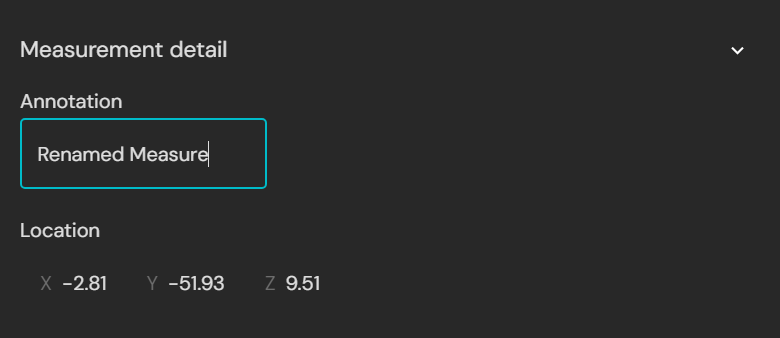
Renamed Point measurements use the updated name in the CSV export.
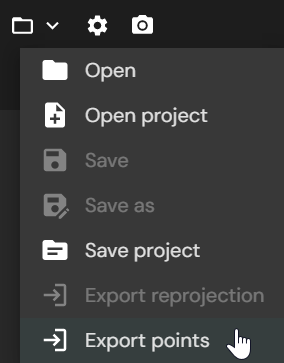
Step 6: Export points
Points can be exported as a CSV file containing ID, X (Easting), Y (Northing), and Z (Elevation in metres).
|
|
Outcome
Measurements have been recorded in the point cloud and are available in the Visualize tab for review, renaming, or visibility control. Point measurements can be exported to CSV for use in external tools.
Additional information
Measurement details
The Measurement Details panel provides additional information about a selected measurement. To view it, select a measurement in the Visualize tab. The details appear in the Properties panel on the right-hand side.
The panel displays the X, Y, and Z coordinates of the measured points along with contextual values, depending on the type of measurement:
Category | Option | Description | |
|---|---|---|---|
Point | X, Y, Z coordinates | The location of the selected point. |
|
Line | Line length | The true 3D distance between two measured points. | |
Horizontal | The distance between the points in the horizontal plane (X-Y), ignoring elevation. | ||
Vertical | The difference in elevation (Z) between the points, ignoring horizontal distance. | ||
Coordinates | The X, Y, and Z values of both endpoints. | ||
Angle | Magnitude | The measured angle between three selected points. | |
Coordinates | The X, Y, and Z values of all three points. |
.png)
Measurement examples
Point | Line | Angle |
|---|---|---|
|
|
|